InstaCharts
2024-09-17
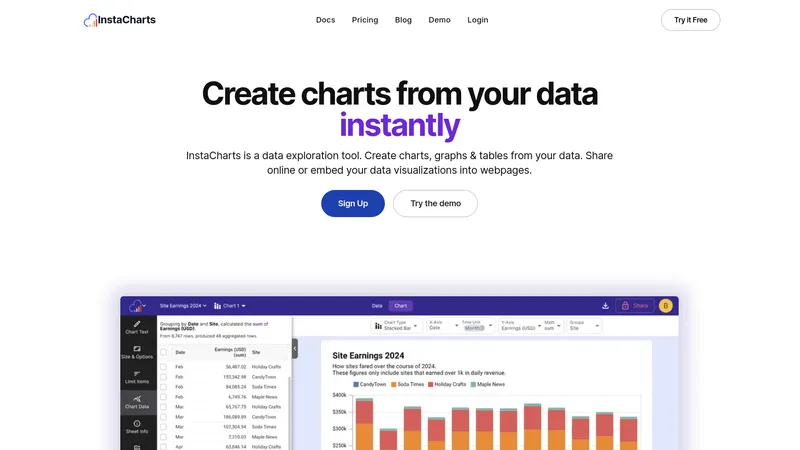
Transform your data into compelling visualizations with InstaCharts. Create, customize and share interactive charts seamlessly from multiple data sources including Google Sheets and CSV files. Sign up for free today!
Categories
AI Data MiningAI Developer Tools
Users of this tool
Data AnalystsMarketing ProfessionalsEducators and StudentsBusiness OwnersFreelance Designers
Pricing
Free Tier (up to 500 rows, watermark on charts)Pro Subscription (unlimited data, no watermarks)Team Subscription (collaborative features, multiple user access)
InstaCharts Introduction
InstaCharts is an innovative data visualization tool that simplifies the process of transforming raw data into insightful charts, graphs, and tables in record time. Designed for professionals across various fields, InstaCharts stands out with its user-friendly interface, allowing users to create compelling data visualizations for reports, presentations, or web embedding with minimal effort. The platform offers seamless integration with popular data sources like Google Sheets, Excel, and CSV files, ensuring a smooth workflow for data manipulation. Users can easily upload their data and utilize InstaCharts' powerful auto-detection feature, which intelligently identifies data types and suggests suitable chart formats. Advanced functionalities enable the creation of interactive charts, allowing stakeholders to engage with the data dynamically. InstaCharts also provides sharing options, making it easy to distribute charts through links or export them as images for offline use. An array of chart types, combined with customization features, makes InstaCharts a versatile tool, empowering its users to uncover hidden trends and present their findings with clarity. The platform supports both free and premium usage models, catering to diverse user needs while maintaining accessibility and ease of use.
InstaCharts Top Features
- Quick data upload and visualization
- Intuitive chart designer with customization options
- Smart data type detection
- Various chart formats available (line, bar, pie, etc.)
- Interactive and shareable charts
InstaCharts Usecases
- A marketing professional needs to visualize sales data from a CSV file. They upload the file to InstaCharts, which auto-detects the data types and generates a bar graph to showcase quarterly growth, enabling faster decision-making.
- A data analyst is tasked with presenting survey results. Using InstaCharts, they import the collected data, select a stacked bar chart, customize colors and labels, and share their findings with the team through a public link for collaborative review.
- An educator requires engaging visual aids for a classroom presentation. They use InstaCharts to create pie charts representing student performance metrics, easily embedding the interactive charts in a presentation software to enhance student engagement.
- A freelance designer is updating a client report. They utilize InstaCharts to transform client data into visually appealing charts, export them as PNG, and seamlessly integrate the visuals into the report, saving time and improving aesthetics.
- A business owner wishes to monitor website traffic trends from Google Sheets. They connect their data source to InstaCharts, use the tool to generate a line chart, and present it in a stakeholders' meeting to demonstrate growth patterns.